



Digital growth is not simply about getting more website visitors, social media followers, or impressions. A business can attract thousands of people online and still struggle to generate leads, sales, or sustainable revenue.
The real question is: What happens after people discover your business?
This is where digital growth metrics become important. By tracking the right key performance indicators (KPIs), businesses can understand where customers come from, how they interact with digital experiences, what drives conversions, and whether marketing activities are producing meaningful business results.
Modern analytics platforms can measure everything from traffic sources and user activity to engagement, key events, purchases, and revenue. However, tracking every available number is not the goal.
The goal is to identify the digital growth metrics that actually help you make better business decisions.
This guide explains 15 important KPIs every business should consider tracking, how they work, and how they can be used to improve digital performance.
What Are Digital Growth Metrics?
Digital growth metrics are measurable indicators used to evaluate how effectively a business is growing through digital channels.
These metrics can cover several areas, including:
- Website traffic
- Customer acquisition
- Engagement
- Lead generation
- Conversions
- Sales
- Customer retention
- Marketing efficiency
- Revenue
A useful KPI should connect digital activity to a meaningful business objective.
For example, website traffic tells you how many people are visiting your website, while conversion rate helps you understand how effectively those visitors complete a desired action.
Similarly, social media impressions may show how widely content is being displayed, while qualified leads can provide a clearer picture of whether that attention is creating potential customers.
The right combination of metrics gives you a more complete view of digital growth.
Why Tracking Digital Growth Metrics Matters
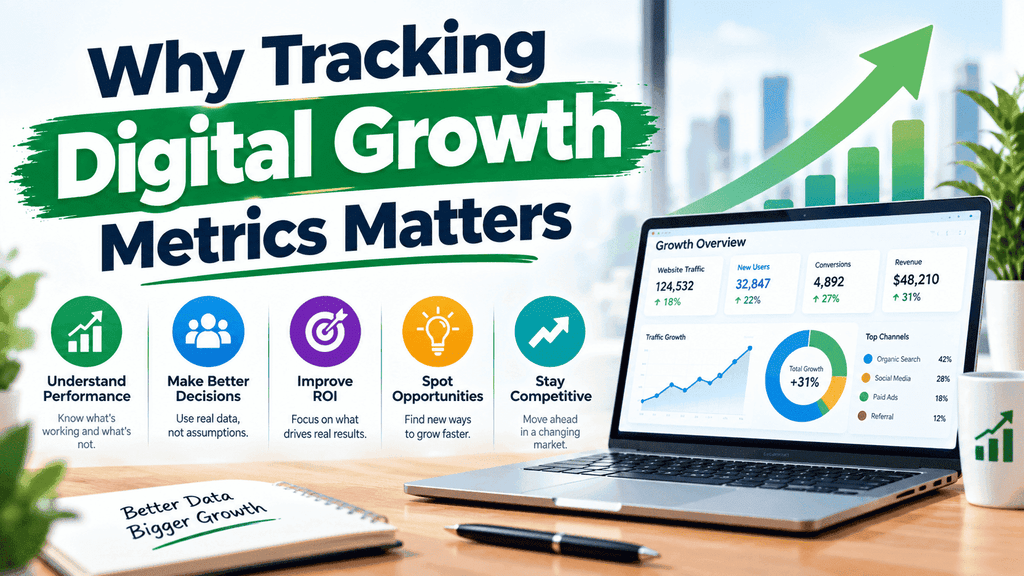
Without measurement, digital marketing can quickly become a collection of assumptions.
You may believe a campaign is successful because traffic increased, while the additional visitors generate very few leads or purchases. Another campaign might attract fewer visitors but produce more qualified customers.
Tracking the right KPIs helps businesses:
- Identify high-performing marketing channels
- Understand customer behavior
- Find conversion problems
- Measure campaign effectiveness
- Control acquisition costs
- Improve website performance
- Understand customer retention
- Connect marketing activity with revenue
- Make decisions based on evidence rather than assumptions
Analytics should therefore be treated as a decision-making system rather than simply a reporting exercise.
15 Digital Growth Metrics Every Business Should Track
1. Website Traffic
Website traffic is one of the most basic digital growth metrics, but it remains useful when interpreted correctly.
It measures the number of visits or sessions generated on your website during a specific period. Traffic data can help businesses understand whether their digital visibility is increasing and where visitors are coming from.
However, traffic alone does not tell you whether your business is growing successfully.
For example, imagine two websites:
Website A: 50,000 monthly visitors with very few leads.
Website B: 10,000 monthly visitors with strong sales.
The second website may generate more business value despite receiving less traffic.
This is why traffic should be analyzed alongside engagement, conversions, leads, and revenue.
What to Monitor
Look at:
- Total sessions
- Users
- New users
- Returning users
- Traffic sources
- Landing pages
- Traffic trends over time
Use traffic data to understand where growth is coming from, not simply whether the number is increasing.
2. Organic Search Traffic
Organic search traffic measures visitors who discover your website through unpaid search results.
For businesses investing in SEO, this is an important growth indicator because it shows whether search visibility is bringing relevant users to the website.
Monitor organic traffic alongside:
- Landing pages
- Search queries
- Engagement
- Key events
- Leads
- Revenue
An increase in organic traffic is more meaningful when it also brings visitors who are relevant to your products, services, or content.
3. Engagement Rate
Engagement rate helps you understand how actively visitors interact with your website or digital experience.
A visitor who spends meaningful time reading content, explores multiple pages, submits a form, or completes another important action is providing stronger engagement signals than someone who arrives and immediately leaves.
Engagement can help reveal problems with:
- Content relevance
- Page experience
- Landing-page quality
- Audience targeting
- Navigation
- User intent alignment
Instead of asking only, “How many people visited?”
Ask:
“Did visitors meaningfully interact with what we provided?”
4. Conversion Rate
Conversion rate measures the percentage of visitors or sessions that complete a desired action.
Depending on your business, a conversion might be:
- Purchasing a product
- Submitting a form
- Booking a consultation
- Signing up for a service
- Creating an account
- Requesting a quote
- Downloading a resource
A simple formula is:
Conversion Rate = Conversions ÷ Total Visitors × 100
For example, if 2,000 visitors generate 60 purchases:
60 ÷ 2,000 × 100 = 3%
Conversion rate becomes particularly useful when comparing landing pages, campaigns, traffic sources, and customer segments.
5. Key Event Rate
Key events represent actions that are particularly important to a business.
Examples include:
- Form submissions
- Product purchases
- Sign-ups
- Demo requests
- Quote requests
- Important content interactions
The key event rate helps you understand how frequently users perform actions that matter to your business.
This can be more valuable than tracking minor interactions that have little connection to business objectives.
The important point is to define events around genuine business goals rather than measuring every possible click simply because it can be tracked.
6. Lead Generation Rate
For service businesses, agencies, B2B companies, and many professional websites, leads can be more important than immediate purchases.
Lead generation rate measures how effectively digital traffic produces potential customers.
A simple formula is:
Lead Generation Rate = Qualified Leads ÷ Relevant Visitors × 100
You can track:
- Contact-form submissions
- Demo requests
- Consultation bookings
- Quote requests
- Newsletter registrations
- Phone-call leads
The key is to distinguish between raw leads and qualified leads.
A website producing hundreds of low-quality inquiries may be less valuable than one producing fewer inquiries from people who closely match the target customer profile.
7. Customer Acquisition Cost (CAC)
Customer Acquisition Cost measures how much a business spends to acquire a new customer.
A basic formula is:
CAC = Total Acquisition Costs ÷ Number of New Customers
Acquisition costs can include:
- Advertising
- Marketing software
- Agency fees
- Sales expenses
- Content production
- Campaign management
CAC should be evaluated alongside customer revenue and customer lifetime value.
If acquisition costs continually increase while customer value remains unchanged, the business may need to improve targeting, conversion rates, retention, or channel efficiency.
8. Customer Lifetime Value (CLV)
Customer Lifetime Value estimates the total value a customer generates over their relationship with a business.
A simplified approach can consider:
CLV = Average Purchase Value × Purchase Frequency × Customer Lifespan
The exact calculation depends on the business model.
For example, a subscription company may evaluate recurring revenue and retention, while an ecommerce business may focus on repeat purchases and average order values.
CLV helps businesses think beyond the first transaction.
A customer who purchases once is different from a customer who repeatedly purchases, renews a subscription, or continues using a service.
9. Customer Retention Rate
Acquiring customers is only one part of growth. Keeping them is another important part of a sustainable business model.
Customer retention rate measures the percentage of customers a business retains during a particular period.
A common formula is:
Retention Rate = (Customers at End − New Customers Acquired) ÷ Customers at Start × 100
Retention is particularly important for:
- SaaS companies
- Subscription businesses
- Membership platforms
- Ecommerce brands
- Service businesses
If customer acquisition is increasing but retention is falling, overall growth may not be as strong as acquisition numbers alone suggest.
10. Churn Rate
Churn rate measures the percentage of customers or subscribers who stop using a product or service during a specific period.
A basic formula is:
Churn Rate = Customers Lost During Period ÷ Customers at Start of Period × 100
For subscription businesses, churn can reveal problems with:
- Product value
- Customer experience
- Pricing
- Onboarding
- Support
- Product-market fit
Tracking churn alongside retention provides a clearer view of customer stability.
11. Average Order Value (AOV)
Average Order Value measures the average amount customers spend per transaction.
The formula is:
AOV = Total Revenue ÷ Number of Orders
Suppose an ecommerce business generates $20,000 from 400 orders.
$20,000 ÷ 400 = $50 AOV
Businesses can use AOV data to evaluate strategies such as:
- Product bundles
- Cross-selling
- Upselling
- Volume discounts
- Free-shipping thresholds
- Premium product positioning
Increasing AOV can help a business generate more revenue from existing transactions without relying only on increasing traffic.
12. Customer Acquisition Channel Performance
Not every marketing channel produces the same type of customer.
Businesses should compare channels such as:
- Organic search
- Paid search
- Social media
- Referral traffic
- Direct traffic
- Display advertising
- Content marketing
Instead of asking which channel sends the most visitors, compare:
Channel → Visitors → Engagement → Leads → Customers → Revenue
This provides a much clearer picture of channel performance.
For example, one channel might generate significant traffic but few customers, while another may generate less traffic but produce highly qualified leads.
13. Return on Marketing Investment (ROMI)
Return on Marketing Investment helps businesses evaluate the financial return generated by marketing activities.
A simplified formula is:
ROMI = (Marketing-Attributed Revenue − Marketing Cost) ÷ Marketing Cost × 100
For example, if a campaign generates $15,000 in attributed revenue and costs $5,000:
($15,000 − $5,000) ÷ $5,000 × 100 = 200%
Attribution can be complicated, especially when customers interact with multiple channels before purchasing.
Therefore, ROMI should always be interpreted according to the attribution method and quality of the available data.
14. Revenue From Digital Channels
Revenue is one of the most important business outcomes to connect with digital marketing.
Depending on your business, digital revenue may come from:
- Ecommerce purchases
- Online subscriptions
- Digital products
- Online bookings
- Lead-generated sales
- Advertising
- Memberships
Tracking revenue by source can help answer questions such as:
- Which channels generate customers?
- Which campaigns generate revenue?
- Which landing pages contribute to sales?
- Which products generate the most revenue?
- Are increasing marketing costs producing additional revenue?
Revenue turns digital activity into a business-focused measurement.
15. Revenue Per Visitor
Revenue per visitor connects website traffic with financial performance.
A simple formula is:
Revenue Per Visitor = Total Digital Revenue ÷ Number of Visitors
For example, if a website generates $10,000 from 20,000 visitors:
$10,000 ÷ 20,000 = $0.50 per visitor
This metric can be useful when comparing traffic sources, campaigns, landing pages, or time periods.
It also demonstrates why traffic volume should not be viewed in isolation.
If traffic increases by 50% but revenue per visitor falls significantly, the additional traffic may not be contributing proportional business value.
Digital Growth Metrics by Business Goal
Different businesses should prioritize different KPIs.
| Business Goal | Important KPIs |
|---|---|
| Increase Visibility | Organic traffic, website traffic, impressions |
| Improve Engagement | Engagement rate, engaged sessions, average engagement time |
| Generate Leads | Lead generation rate, key event rate, qualified leads |
| Increase Sales | Conversion rate, revenue, AOV |
| Improve Acquisition | CAC, channel performance, conversion rate |
| Improve Retention | Retention rate, churn rate, CLV |
| Improve Profitability | ROMI, CAC, CLV, revenue per visitor |
| Grow Ecommerce | Conversion rate, AOV, revenue, repeat purchases |
There is no universal KPI combination that works for every company.
A local service business, ecommerce store, SaaS company, publisher, and B2B organization may all require different measurement frameworks.
Vanity Metrics vs. Meaningful KPIs
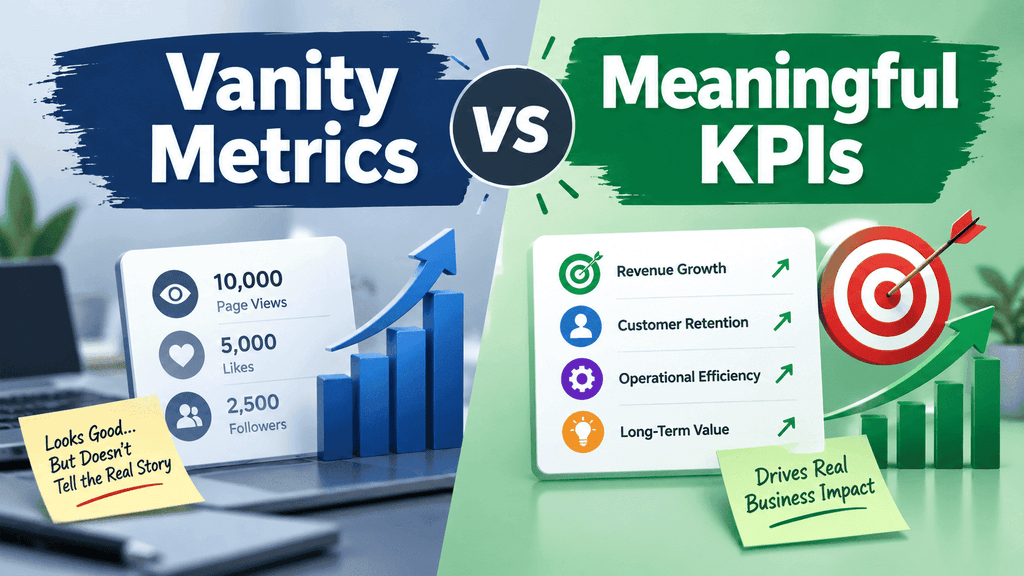
One of the biggest problems with digital analytics is confusing attention metrics with business performance metrics.
For example:
Vanity metric: 100,000 social media impressions
Business-focused metric: 250 qualified leads generated from social media
Both numbers can be useful, but they answer different questions.
Vanity metrics are not necessarily useless. They become problematic when they are treated as proof of business growth without additional context.
A better approach is to connect upper-funnel metrics to downstream outcomes.
For example:
Impressions → Clicks → Visitors → Engagement → Leads → Customers → Revenue
This creates a more complete measurement journey.
How to Build a Digital Growth KPI Dashboard
A useful dashboard does not need dozens of charts.
Start with your primary business objective.
Step 1: Define the Business Goal
Decide whether your current priority is:
- Traffic growth
- Lead generation
- Sales
- Customer retention
- Revenue
- Profitability
Step 2: Identify the Primary KPI
Choose the metric that most directly represents the goal.
For example:
Goal: Increase online sales
Primary KPI: Revenue or completed purchases
Step 3: Add Supporting Metrics
Supporting metrics explain why the primary KPI is changing.
For ecommerce, you might track:
- Traffic
- Engagement
- Add-to-cart actions
- Checkout progression
- Conversion rate
- AOV
- Revenue
Step 4: Segment the Data
Analyze metrics by:
- Traffic source
- Device
- Landing page
- Campaign
- Product
- Customer type
- Geographic market
Segmentation can reveal patterns that are hidden inside overall averages.
Step 5: Establish a Consistent Reporting Period
Compare similar periods and avoid drawing conclusions from very small datasets.
Weekly reporting can help with active campaigns, while monthly or quarterly analysis may provide better context for broader growth trends.
How to Avoid Common KPI Tracking Mistakes
Tracking Too Many Metrics
More data does not automatically mean better decisions.
If your dashboard contains dozens of metrics but nobody knows which ones matter, it becomes difficult to identify priorities.
Focus on a small group of KPIs connected to specific business goals.
Focusing Only on Traffic
Traffic is useful, but traffic without meaningful actions may not create business growth.
Always connect traffic with engagement, conversions, leads, customers, or revenue where appropriate.
Ignoring Data Quality
Incorrect tracking can produce misleading conclusions.
Check whether important events are configured correctly and whether your analytics implementation accurately records the actions you care about.
Comparing Unrelated Periods
A campaign launched during a seasonal sales period should not automatically be compared with a normal period.
Consider:
- Seasonality
- Promotions
- Product changes
- Pricing
- Marketing spend
- Website changes
- Market conditions
Measuring Without Taking Action
Analytics becomes valuable when it changes what you do.
If conversion rate falls, investigate the funnel.
If CAC rises, examine acquisition channels.
If retention declines, investigate customer experience.
If revenue grows while traffic remains stable, identify what changed in conversion, pricing, product mix, or customer value.
How to Connect Digital Growth Metrics Together
The strongest measurement systems do not treat every KPI as an isolated number.
Consider this simplified growth funnel:
Reach → Traffic → Engagement → Key Actions → Leads → Customers → Revenue → Retention
Each stage answers a different question.
Reach: Are people discovering us?
Traffic: Are they visiting?
Engagement: Are they interacting meaningfully?
Key actions: Are they doing what matters?
Leads: Are potential customers entering the pipeline?
Customers: Are leads becoming buyers?
Revenue: Is digital activity generating financial value?
Retention: Are customers staying?
This approach helps businesses understand not only what happened, but also where improvement opportunities may exist.
A Practical KPI Example
Imagine an ecommerce business has the following monthly results:
- 30,000 visitors
- 2,100 engaged sessions
- 900 add-to-cart actions
- 450 checkout starts
- 120 purchases
- $9,600 revenue
Instead of looking only at the 30,000 visitors, the business can examine the complete customer journey.
It can investigate:
- Which traffic sources generated the visitors?
- Which pages attracted the most engagement?
- How many visitors added products to their carts?
- Where did users leave the checkout?
- Which campaigns generated purchases?
- What was the average order value?
- How much did customer acquisition cost?
- Which customers returned for another purchase?
This produces actionable insights that a traffic number alone cannot provide.
The Difference Between Metrics and KPIs
The terms “metric” and “KPI” are often used interchangeably, but there is an important distinction.
A metric is a measurable data point.
A KPI is a metric that has been selected because it directly helps evaluate progress toward an important business objective.
For example:
Metric: Page views
KPI: Qualified leads generated
Page views may provide useful context, but qualified leads might be more directly connected to a lead-generation objective.
This is why businesses should not automatically treat every available analytics metric as a KPI.
Should Every Business Track All 15 KPIs?
No business needs to place all 15 KPIs on its main dashboard.
A small ecommerce business might prioritize:
- Traffic
- Conversion rate
- AOV
- CAC
- Revenue
- Retention
- CLV
A B2B service company might focus more heavily on:
- Organic traffic
- Engagement
- Lead generation rate
- Qualified leads
- CAC
- Customer acquisition
- Revenue
A subscription company may emphasize:
- Acquisition
- CAC
- Conversion rate
- Retention
- Churn
- CLV
- Recurring revenue
The right KPI framework depends on your business model, customer journey, and current growth objective.
FAQs
Conclusion
Digital growth is not measured by one number.
Website traffic, engagement, leads, conversions, acquisition costs, customer value, retention, and revenue all provide different pieces of the growth picture.
The most effective approach is to connect these metrics to real business objectives.
Start with the outcomes that matter most to your business, choose KPIs that directly reflect those outcomes, and then use supporting metrics to understand what is driving the results.
Most importantly, do not chase numbers simply because they are increasing. A growing metric is only valuable when it represents meaningful progress toward your business goals.
By building a focused measurement system around the right digital growth metrics, businesses can turn analytics data into clearer decisions, better customer experiences, and more informed growth strategies.